

Quick Summary
Payroll in most organizations runs at roughly 25% of revenue, making it one of the most powerful levers for improving profitability. Seasoned CEOs and talent leaders estimate that as much as 20% or more of payroll expenses are wasted on underperformers—a drag on both margins and momentum.
Key Takeaways
- Payroll is typically around 25% of revenues in most companies, making it the single largest fixed expense.
- The hidden cost of poor hiring decisions is often 5-20% or more of total payroll.
- In your Power of One analysis, carve payroll out of other fixed expenses and consider the impact of eliminating wasted payroll expenses as part of your profit and cash improvement strategies.
- To see how much extra revenue is required to fund hiring mistakes, use this formula: Additional Revenue Required = Wasted Payroll ÷ Net Profit Margin.
In the Scaling Up Performance Platform, we specifically coach on the interrelationship of People, Strategy, Execution, and Cash. The combination of these four factors drives our brand promise for your business: a maximum and strategic valuation when you’re ready to exit. For a strategic valuation, we like to see a number greater than 10x earnings before interest, taxes, depreciation, and amortization (EBITDA).
People drive or deteriorate EBITDA in a multitude of ways. Let me share what happened when I asked a simple, but powerful question to a series of CEOs and senior talent leaders.
“How much of your payroll is wasted on bad hires?”
The reaction was immediate. They all said, “Whoa!!!” “Did you really ask that?” Then the conversation went quiet.
It felt as though I had crossed into deeply personal territory, like I had asked something no one had ever dared to quantify out loud. Payroll is treated as sacred. Necessary. Fixed. I might as well have asked them something you only whisper about in impolite company, because no one frames payroll this way.
But once you do, people can’t unsee the truth.
I let the silence hang a little longer than was comfortable. You could almost feel the math taking place in their heads—the mental roll call of names, the ignored bad hires, and the projects that had slipped.
Soon, the responses came with the pent-up frustration of a therapy session.
One executive responded, “At least 10%.”
Another leaned back, exhaled slowly, and said, “Seventeen percent.” She paused, then added, “And I can give you names!”
Next, an SVP of Talent from a $5B firm looked down at his numbers, shook his head slowly, and said, “Oh my God… it could be as much as 20%.”
It seemed painful to admit. And yet, at the same time, it felt good, like finally exorcizing a demon, one dead set on justifying hiring mistakes.
It was like someone had finally asked the deep, dark question that had been sitting just beneath the surface for years—the reality everyone sensed, but no one had dimensioned. Yet I didn’t force those numbers out of them. These hidden costs surfaced on their own because once you permit leaders to measure the gap between expected A Player performance and actual output, the truth about lost productivity tends to find its way into the room.
Because now it’s no longer just a feeling. Now it’s a leadership decision that needs to be made.
The Massive Effect of Bad Hiring Decisions on Profitability
Intuitively, most CEOs and business owners understand that payroll is a big deal. It’s typically the single largest line item on the income statement and the one expense that touches every function in the business.
Just like taxes, you don’t truly feel the impact until you run the numbers. You may know payroll expenses are significant, but their magnitude remains abstract until you put a real dollar amount on them.
For most growth businesses, payroll runs between 20% and 25% of revenue. Payroll taxes and associated employee benefits usually add a 10% drag on top of it. That means if you’re leading a $20M–$100M company, even a modest inefficiency in payroll or lost productivity quietly erodes profitability at a surprising scale.
When you put percentages against real revenue, the financial gravity of the damage becomes unmistakable:
Company Revenue | Payroll (25%) | 20% Waste | 10% Waste | 5% Waste |
$20M | $5M | $1,000,000 | $500,000 | $250,000 |
$50M | $12.5M | $2,500,000 | $1,250,000 | $625,000 |
$100M | $25M | $5,000,000 | $2,500,000 | $1,250,000 |
Even at a conservative 5%, the drag is material. At 10%, it becomes strategic. At 20%, it’s staggering.
And remember, this isn’t discretionary spending. This is salaries paid with the expectation of A Player performances that you’re not getting. When payroll represents a quarter of your revenue, small percentage gaps translate into big consequences for profitability and valuation. The cost of bad hiring decisions is greater than you might think.
The Power of One: Payroll as an Overlooked Strategic Lever in Profit and Cash
Using the $20M revenue business shown above as a model, let’s explore the magnitude of fixing wasted payroll versus other potential profit levers in your business.
The Scaling Up Cash tool is a proprietary component of the Scaling Up Performance Platform. It provides a disciplined way to understand exactly how profitability and cash are created inside a business. At the center of that tool is the Power of One analysis.
Power of One allows you to dimension the impact of a 1% improvement across the select handful of drivers that determine profit and cash. To improve profitability or cash, you must move one or more of these drivers. There’s no other path.
In the traditional Scaling Up Power of One analysis, there are seven primary drivers.
Four variables affect both profit and cash:
Price
Volume
Cost of Goods Sold (COGS)
Fixed Overheads
Three additional variables primarily affect cash:
Accounts Receivable Days
Inventory or WIP (work in progress) Days
Accounts Payable Days
The Power of One framework alone illuminates hidden costs and creates enormous clarity. But here is where more sophisticated financial thinking about payroll expenses and A Player performance comes into play.
Most financial models lump payroll into SG&A, where it quietly blends into a broader operating expense line. That approach obscures the true leverage of your highest controllable cost. Payroll deserves independent scrutiny, not only because it typically represents the single biggest expense on the income statement, but also because it’s the one most directly tied to leadership quality, hiring rigor, and performance standards.
Rather than leaving payroll as hidden costs buried inside fixed overhead, we intentionally carve it out as its own analytical slice. This is a more sophisticated and surgical move. By isolating payroll, we shift from general cost management to precision performance management. We ask a far more strategic question:
Are we receiving A Player output for A Player compensation?
When you analyze payroll in this way, the financial sensitivity becomes far clearer and far more actionable.
Most companies analyze overhead at a blended level. More advanced operators disaggregate major cost categories to understand sensitivity at a deeper level. When payroll represents 20%–25% of revenue, separating it allows you to see its individual leverage rather than letting it hide inside a composite fixed expense line.
Once you isolate payroll costs, the numbers speak clearly. Here are the impacts for that $20M revenue business mentioned above. This business has a 51% gross margin, and 25% of total revenue is consumed by payroll, netting a $2.2M operating profit at 11%.
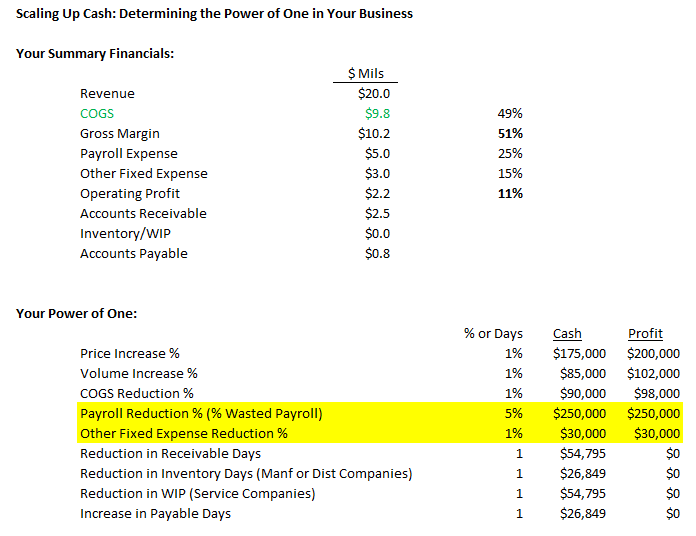
Each business has its own unique Power of One signature—its financial DNA. The proportional contribution of each lever depends on that company’s price-to-volume power ratio, cost of goods sold, gross margin profile, payroll structure, other fixed overheads, and working capital dynamics.
That said, for almost every business on the planet, pricing is the No. 1 profit lever by a wide margin. As this example shows, it can dwarf the impact of a volume increase by more than a 2:1 ratio. What makes this illustration particularly interesting, however, is that we modeled for a conservative 5% wasted payroll, and it produces a meaningful impact on both profit and cash.
By “freeing up the future” of a few B and C Players, this business unlocks $250,000 in both profit and cash. Of all the strategies available, payroll reductions (and other fixed overhead adjustments) and pricing are the only actions that deliver a profit increase from the moment the decision is made. And of those two, only payroll reductions and fixed overhead improvements translate 100% of that profit directly into cash. Pricing actions, while powerful, still flow through accounts receivable performance before they fully convert to cash.
Note: This is the same $250,000 of payroll costs in the original example, just integrated into the Power of One to provide context for comprehensive decision-making versus other profit and cash levers.
One Quick Caution About Magical Thinking
When executive teams walk through the Power of One, there’s sometimes a belief that there must be some voodoo outside this structure—some breakthrough tactic that improves profitability or cash without touching these drivers.
There isn’t.
Every financial improvement ultimately flows through one or more of these variables. If performance is going to move, one or more of the underlying drivers have to change. That’s how the math works. Don’t fall for the illusion that something else might magically fix the numbers or the cost of poor hiring decisions.
The only way to understand your unique leverage profile is to carve out your payroll costs and run your own Power of One analysis. When you do, the priority levers become unmistakable—and so does the leadership responsibility to decide which levers to move, particularly in the area of wasted payroll.
Feeling the Impact: How Much Additional Revenue Is Needed to Offset Bad Hire Costs?
It’s curious how many business executives cannot clearly articulate the formula for determining the breakeven cost of adding a new employee. It’s the same calculation elite CFOs use when evaluating any addition to overhead—whether it’s for programs, equipment, facilities, or systems. The math does not change simply because the investment is human.
Every addition to payroll costs increases fixed expenses. To maintain your current net profit margin percentage—the ultimate measure of productivity—that compensation must be supported by incremental revenue.
The formula is straightforward:
Breakeven Revenue = Fully Loaded Compensation ÷ Net Profit Margin
So in our example above, the same logic applies to the revenue burden needed to cover wasted payroll:
Revenue Burden Required = Wasted Payroll ÷ Net Profit Margin
For our sample $20M revenue business, the math is as follows:
$2,272,727 = $250,000 ÷ 11%
The numbers don’t lie: $2.27M of this business’s $20M in revenue is needed just to absorb the cost of the underperforming bad hires and wasted payroll. It means that 11.35% of revenue is essentially a carrying cost of apathy.
Ready to Improve Your Bottom Line?
No one in the course of recorded human history has ever fired someone too quickly. Each time, your A Players will ask, “What took you so long?”
Contrary to popular belief, in business, we’re neither running an employment charity nor an adult daycare. Unproductive payroll and hiring mistakes are hampering the profitability, growth, and joy of your business in unfathomable ways.
It doesn’t need to be this way.
At A Player Advantage, we’re among the foremost experts in talent and in implementing the Scaling Up Performance Platform. We help leadership teams build organizations of 100% A Players—people who produce, perform, and pay for themselves.
If you want every employee on your team to generate a measurable return—and then some—we’ll show you how.
What’s Next?
If you’re not already a member
Click Here:
Already a member?
Click Here to Login:
Read The A Player Agreement™ Playbook

Download the Ultimate in Talent Assessment Tools

Let’s Build Together!
If you’re ready to stop settling and start scaling, there has never been a better time to reach out to Rick and the A Player Advantage team. Whether you want to talk about cashflow, hiring 100% A Players, or strategically scaling for exit, A Player Advantage is here to help! Reach out today to get started.

Recent Comments